Home page > Be datasheets
Hα-Spectroscopy and V-Variations of Be star 28 Tauri (Pleione)
Wednesday 22 December 2010 by Ernst Pollmann
Building on the successful BAV review article by Hassforther (2008) on the same subject, with this contribution I would like to show the correlation between V brightness and Hα emission, as part of the collaboration between the variable star observer Sebastian Otero (Argentina) and me.
The publication by Tanaka et al. (2007) in combination with the impressive analysis of Hirata (2007) inspired me comparing his records relating to the long-term brightness variations in V with variations of the spectroscopic Hα-emission. As a member of the Pleiades cluster the Be star (spectral type B8e) 28 Tau is well known as a shell star with photometric and spectroscopic long-term variations since the 19th century. In the past period of about 100 years it showed cyclic changes of its spectrum from a Be phase (fig. 1) to a Be envelope phase (fig. 2) with a period of 35-36 years: 1974 first early Be envelope phase with maximum expression 1981; 1989 start of a Be phase with maximum expression in 2004 where he remained until end 2005.
Fig. 1: Own prism spectra of 28 Tau during Be phase (1989 until approx. end of 2005)
In addition 28 Tau is known since a lunar occultation (Gies et al. 1990) as a spectroscopic binary star with a period of 218 days and a large eccentricity of 0.6. One ascribes this orbital period today to the disk precession of the primary star. The observed changes of the spectral characteristics of a Be phase to a Be envelope phase (and back) with a period of 35-36 years is according to research by Hummel (1998) because the disk "for some reason" (probably caused by the companion star in the periastron) is not in the equatorial plane but slanted to the Equator and precesses around the central star, which manifests itself in variations of the Hα line profile. Calculations of Hirata (2007), based on polarimetric studies have shown that the inclination angle of the central star is 60 ° and the direction of the disc axis projected on the sky varies between 60 ° and 130 °.
Currently the last Be phase > envelope phase observations are interpreted (especially during the period November 2005 to April 2007) as follows: Every 35-36 years the spectroscopic companion star in the periastron produces a mass loss at the primary star; as a result, a new disc is made in its equatorial plane. During this process the old disc is already out of this equatorial plane, due to the precession caused by the companion. This process is then directly manifested in Hα emissivity.
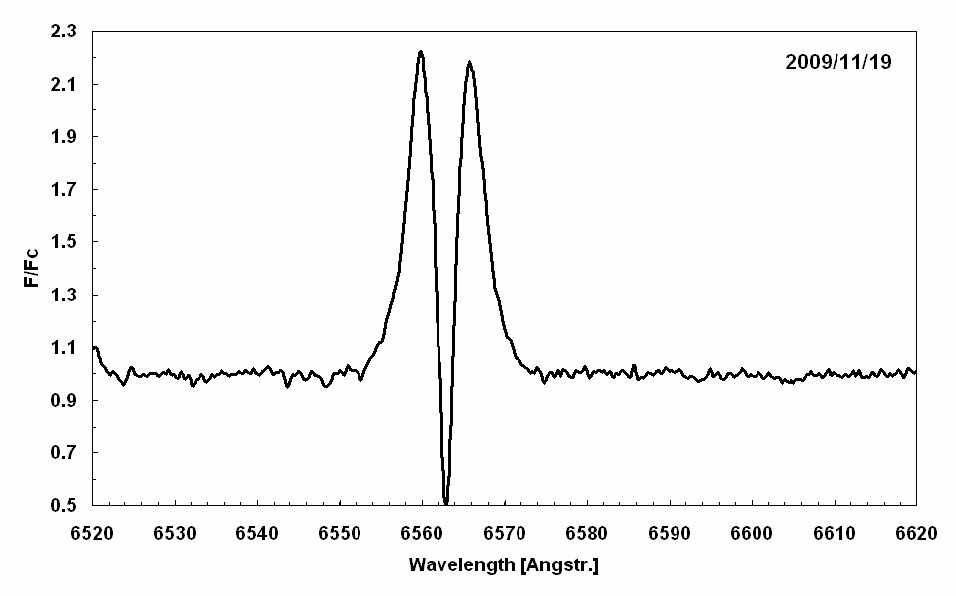
The new disc in the equatorial plane creates the envelope spectrum (fig. 2), which develops also by the effect of precession and the characteristics of this envelope spectrum gets weaker and transforms back to the Be phase (fig.1) with increasing Hα emission intensity and increasing disk radius.
Fig. 2: High-resolution grating spectrum of 28 Tau (2009/11/19) in its current Be shell phase
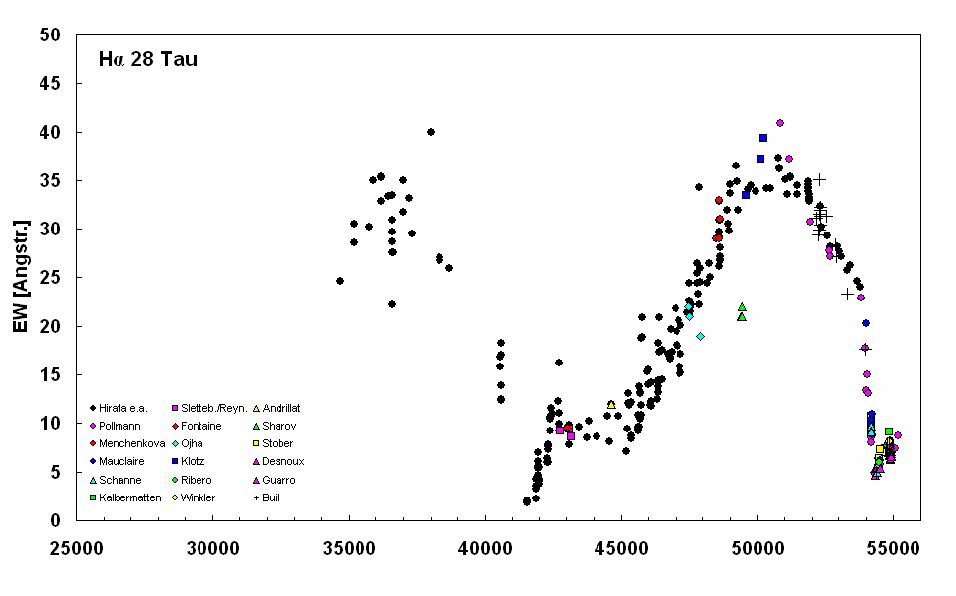
The V magnitudes from the database by S. Otero (private communication 2009; Sources: see legend in the medium-sized plot), published V data by Tanaka et al. (2007) and Hα-equivalent width measurements (EW) of the long time monitoring by spectroscopic observers (sources: see legend in the upper plot) made it possible to relate within a correlation analysis V and EW.
Fig.3a shows the monitoring of Hα-EW from professional and amateur observations, 3b shows the historical V light curve from various sources, and 3c shows the correlation of intrinsic Hα line flux versus V brightness from 74 simultaneous measurements. Fig. 3c it is shown to what extent the brightness increase of V is influenced by the brightness of the disc (determined by the Hα EW). Because 74 simultaneous measurements of V and EW could be identified from all measurements, it is possible to establish a correlation between Hα EW and overall brightness. To do so one has to convert V into a photon flow F = 10^(-0.4*V).
The EW has to be normalized as well by dividing through the continuum flux F. If one assumes that the variation of brightness is mainly determined by the brightness of the disc, then a linear relationship should be observed when the normalized Hα EW is plotted against the flow of photon F. At EW = 0 (photospheric) V brightness (strictly taken only at Hα wavelength 6563) would be ≈ 5.4. In other words, each increase above this value would therefore be attributable to Be star disc emissivity.
Fig. 3a: Time behaviour of Hα equivalent width from professional and amateur observations
Fig. 3b: Historic V light curve from various sources
Fig. 3c: Correlation of intrinsic Hα line flux versus V brightness from 74 simultaneous measurements
References
Gies, D. R. et al. 1990, AJ, 100, 1601 Hassforther, B., BAV-Rundbrief, 1/2008, 35 Hirata, R. 2007, in ASP Conf. Ser. 361, Active OB Stars (San Francisco:ASP 267) Hummel, W., 1998, A&A, 330, 243 Tanaka, K. et al. 2007, Publ. Astron. Soc. Japan (PASJ), 59, L35-L39,
Ernst Pollmann
Portfolio


![]() en
en
![]() Be datasheets
?
Site created with SPIP 2.1.23 +
AHUNTSIC
Be datasheets
?
Site created with SPIP 2.1.23 +
AHUNTSIC
